
AI client reporting is at its best when it disappears into the workflow. The client opens a dashboard or receives a summary, sees the numbers that changed, and gets a clear explanation without anyone spending half a day copying charts from one place to another.
When it’s done badly, it becomes another layer of noise. And when it’s done well, it trims the dullest part of reporting and leaves the real work: understanding what moved, what caused it, and what should happen next.
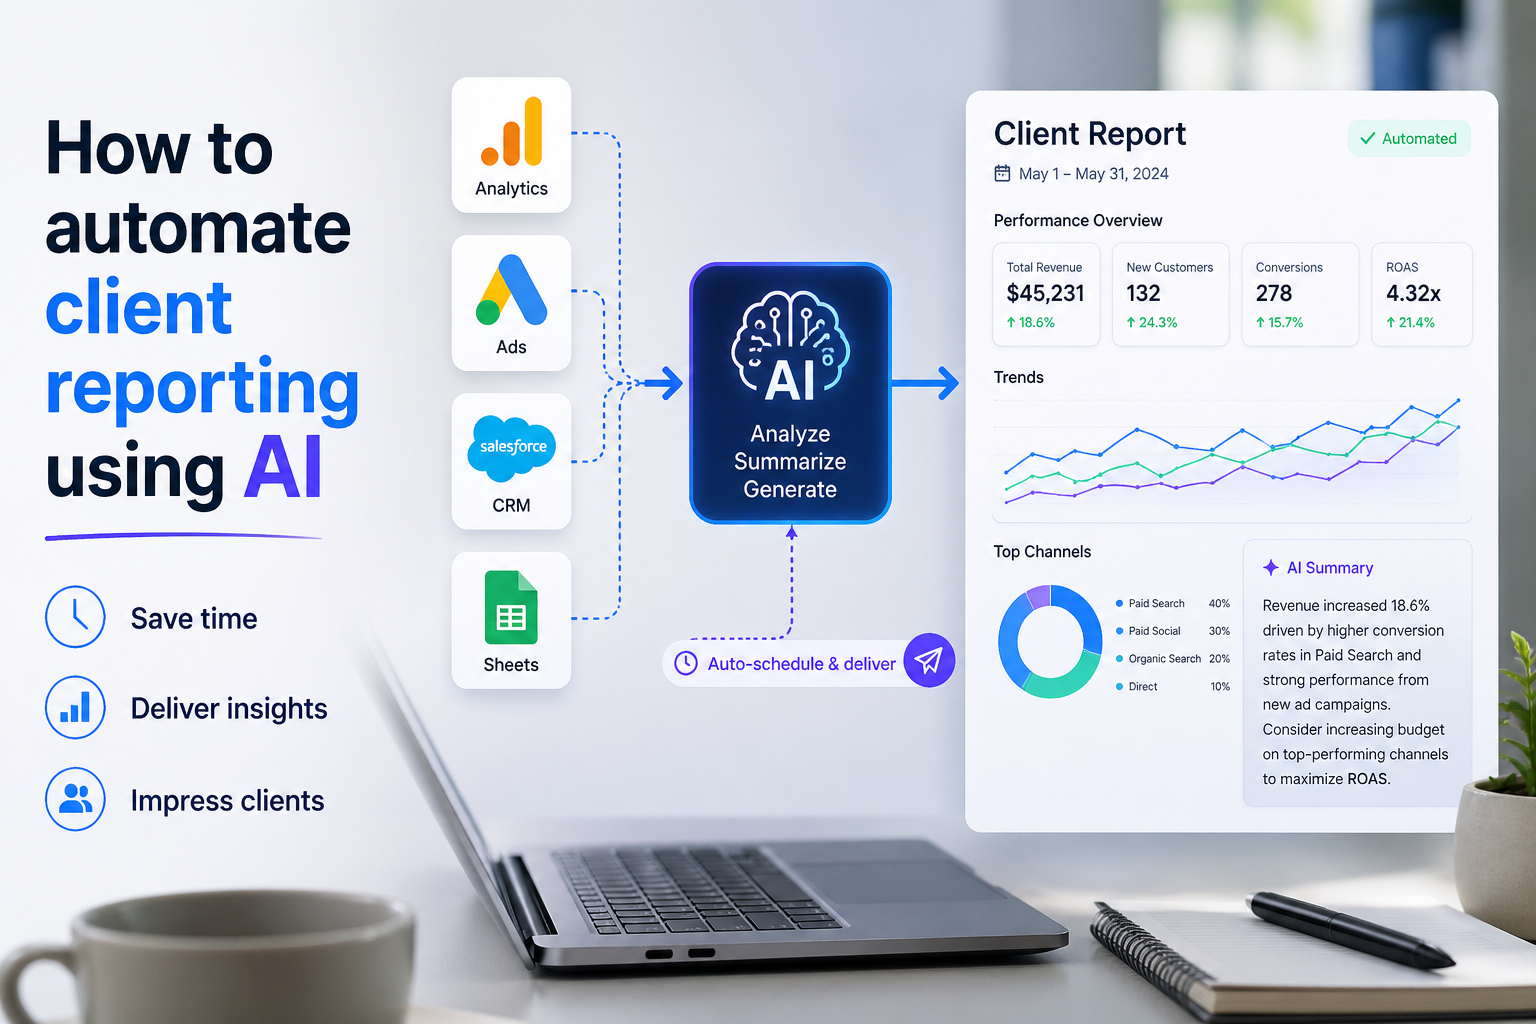
The useful version is not a single tool but a chain of tools. Data comes in from ad platforms, analytics, CRM systems, and sometimes billing or product usage tools. The numbers are cleaned up, mapped to shared definitions, and pushed into a report or dashboard that updates on a schedule.
A language model or rules engine then turns the data into a short narrative, usually with notes on changes, outliers, and follow-up questions. That sounds neat on paper. In live client work, it can be a bit rough around the edges, which is exactly where the interesting decisions start.
Most teams do not need a grand redesign. They need a reporting stack that holds together on a Tuesday morning when one connector fails, a campaign changes naming conventions, or a sales team decides to redefine a conversion. That is where the real value sits.
What Actually Breaks Client Reporting
The basic job is simple: collect data, standardize it, explain it, and send it out without manual stitching. The harder part is making sure the report says something true.
A dashboard filled with live charts is not useful if the underlying definitions are vague. A report that says revenue went up 18% is not helpful if everyone is using a different revenue number.
This is why the strongest reporting setups begin with source control at the metric level. A team might pull paid media data from Google Ads, site behavior from Google Analytics Data API, and pipeline data from HubSpot or Salesforce, then map them into a shared model before anything is shown to a client. That shared model is the part people skip when they are rushing. It is also the part that saves them later.
Once the data is clean, AI can help with two things people actually feel day to day.
First, it can flag changes that deserve attention. Second, it can write the first pass of the explanation. The first is more valuable than it sounds. A sharp decline in conversion rate, a cost spike in one region, or a sudden shift in lead quality is easier to catch when the system watches the data continuously instead of once a month.
Building the Pipeline Without Making It Fragile
In many teams, the pipeline starts with a spreadsheet because that is what everyone already knows. It works for a while. Then one formula gets broken, the file becomes a shared mess, and every report turns into a small archaeology project. At that point, moving the data into a proper ingestion layer is usually the right move.
Tools such as Supermetrics and Funnel are common because they reduce the amount of manual pulling and formatting. They are not magic. They still depend on the quality of the source systems, naming conventions, and account access. But they do solve a very real problem: teams lose a lot of time simply getting the same data into the same shape every month.
The point of the pipeline is not to make it fancy. It is to make it boring enough that it does not need constant attention. That means using stable field names, documenting metric logic, and checking the refresh schedule. If the data updates every morning at 7:00 but the client expects a noon review, the timing should be explicit. If a source is delayed, the report should say so. Silent failure is the worst kind.
For teams with larger volumes or more clients, a warehouse such as BigQuery becomes a sensible middle layer. It gives more control over joins, historical comparisons, and shared definitions. It also makes it easier to keep the reporting logic separate from the presentation layer. That separation is useful when a client wants a custom view but the back-end logic should stay the same.
AI Client Reporting in Dashboards and Summaries
Dashboards are the visible part, but they are not the whole story. The best ones do not try to show everything. They show the few measures a client actually checks: spend, leads, conversions, revenue, retention, or whatever the working set is for that account. If the dashboard becomes a museum of charts, nobody reads it.
Looker Studio is still a common choice for lighter reporting needs, especially when teams want a clean, shareable view without a heavy build. Other tools like Databox and Whatagraph are often used when there is a stronger need for branded client reports and scheduled delivery. The choice depends less on feature lists and more on how many clients you need to support, how much customization each one expects, and how much maintenance your team can tolerate.
Where AI starts to earn its keep is in the summary layer. A monthly report with a short paragraph that says traffic rose, spend held steady, and conversions improved after a landing page change is a much better object than a stack of charts alone. The summary does not need to sound clever. It needs to be specific, plain, and tied to the actual data. A good summary explains the trend, names the channel, and points to the likely driver. A bad one says performance improved without saying how or where.
There is a useful trick here: ask the system to write only what it can support from the numbers on the page. That keeps the output grounded. When AI is left to improvise beyond the data, it tends to produce tidy nonsense.
Where the Setup Breaks
Most reporting failures are not dramatic. They are quiet. A connector stops refreshing. A source changes field names. A sales team revises the definition of a qualified lead and forgets to tell anyone. The report still renders, which is almost worse than an outright error because people trust it for a few extra days.
Another common failure is overfitting the report to internal preferences. A team builds a dashboard around the metrics they enjoy looking at, not the ones the client uses to make decisions. That can produce beautifully organized clutter. If a client only cares about booked revenue and pipeline quality, a dashboard with fifteen top-of-funnel charts is just decoration.
There is also the issue of narrative drift. Once a summary tool has been used for a few months, small inaccuracies can settle in. A model may repeat a pattern from an earlier month, mention a campaign that was paused, or describe a trend that no longer exists. This is why a human review step still belongs somewhere in the process. Not every report needs a full edit pass, but somebody should look at the numbers before the client does.
One more thing: standardization cuts both ways. A rigid template keeps the system manageable, but it can flatten unusual accounts. Some clients want a report that reflects a product launch, a seasonal cycle, or a one-off event. The system should allow for that without turning every report into a custom build.
What to Check Before Turning it On
Before you let the reporting stack run on its own, check the boring parts. Confirm that each source is authenticated correctly and that access will not expire next week. Verify the metric definitions. Make sure date ranges, time zones, and attribution windows are the same across tools. Those small differences cause more confusion than most teams expect.
It also helps to decide where the report lives. A live dashboard is useful for ongoing monitoring. A scheduled email summary is still useful for clients who want something they can read quickly and archive. Some teams do both. That is not redundant if the audiences are different.
Review the cost of the stack as well. API-based connectors, warehouse storage, and client-facing dashboard tools all add recurring expenses. The cheaper setup is not always the simpler one, and the expensive one is not always better. The right choice depends on how many clients you serve, how often reports change, and how much time your team is currently losing to manual work.
There is a final check that often gets skipped: ask whether the report will still make sense if a single source disappears for a day. If not, build a fallback. A report that collapses because one upstream tool hiccupped is not ready for client use.