Most AI agents look reliable during demos. The problems usually begin after deployment. You usually notice something small first. The visible problem is often only the last step in a much longer chain of events.
Traditional logs do not help much here because they were built for predictable software flows. Agents do not behave that way. One request can branch into multiple model calls, retrieval steps, validation checks, and external tools, all changing slightly from run to run. By the time something breaks, the original cause may already be buried several layers deep.
This is where agent observability becomes operational infrastructure instead of a monitoring add-on. Trace-level event logging gives engineers a way to reconstruct how an agent arrived at a decision, which systems influenced the output, where execution slowed down, and what changed between successful and failed runs.
Over the last year, observability frameworks such as OpenTelemetry have started shaping how AI systems emit traces, logs, and execution metadata. AI-focused platforms like Langfuse and tracing support inside the OpenAI Agents SDK are pushing the ecosystem toward standardized instrumentation rather than isolated debugging hacks.
AI agents generate outputs probabilistically, choose tools dynamically, and alter execution paths in ways conventional software rarely does. Once workflows become multi-step, debugging without traces becomes painfully slow.
Where Traditional Logging Breaks Down
Conventional application logs were designed for deterministic systems. A request enters an API endpoint, business logic executes in a predictable sequence, and the output follows a relatively stable path.
Agents behave differently.
A single request may trigger:
- multiple model calls
- retrieval operations
- memory lookups
- tool execution
- validation layers
- fallback logic
- reasoning loops
- handoffs between specialized agents
The execution graph changes from one run to another.
That variability introduces a frustrating debugging problem: the visible error is often not the actual failure point.
For example, an internal support agent appeared to intermittently “forget” customer account details during refund processing. Initial debugging focused on prompt quality because the outputs looked incomplete. The actual issue turned out to be a retrieval timeout inside a vector search service. The timeout triggered fallback behavior, which produced a confident but partially informed answer.
The model was functioning normally, the infrastructure around it was not.
Without trace-level logging, the problem looked like hallucination. With traces enabled, engineers could see the exact point where the retrieval span failed and how the fallback chain altered the final response.
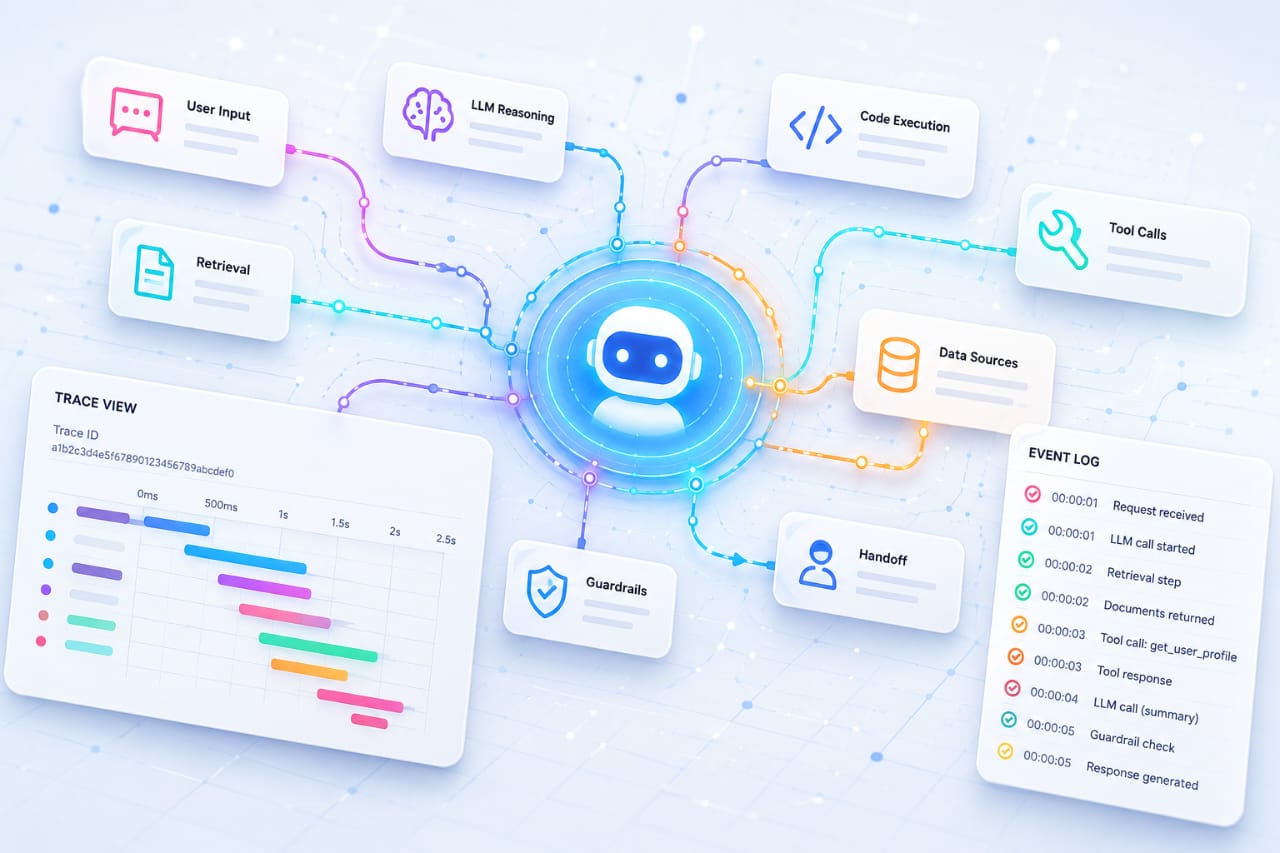
What Trace-Level Event Logging Actually Captures
Trace-level logging records the operational timeline of an agent run.
Each workflow execution receives a unique trace identifier. Every major action inside that workflow becomes a span connected to the parent trace.
In practice, a trace may contain:
- LLM requests and responses
- tool calls
- database queries
- vector retrieval operations
- memory writes
- guardrail checks
- retry attempts
- validation failures
- handoffs between agents
- latency measurements
The value comes from correlation. Instead of reading disconnected logs across multiple services, engineers can follow a single execution path from start to finish. That changes debugging entirely.
For example, consider an autonomous research agent generating inconsistent citations. A trace might reveal:
- the retrieval layer returned duplicate documents
- the reranker exceeded latency thresholds
- the context window truncated earlier sources
- the citation formatter retried with partial inputs
The final bad output becomes understandable because the execution history remains intact.
Designing Observability Around Agent Workflows
One mistake many organizations make is treating AI observability as an extension of application monitoring dashboards. It is not the same problem space.
Agent systems need workflow visibility, not just infrastructure metrics.
A useful observability design usually starts with a simple principle: every meaningful decision path should leave evidence behind.
That includes both successful and failed operations.
Start With a Root Trace
Every user request or scheduled workflow should begin with a root trace. Everything downstream inherits that context.
This sounds obvious until systems become distributed across orchestration frameworks, tool layers, retrieval services, and external APIs. Without consistent trace propagation, observability fragments quickly.
One broken span relationship can make an entire workflow difficult to reconstruct.
Frameworks adopting OpenTelemetry conventions are beginning to solve this problem more cleanly by standardizing trace context propagation across services.
Instrument Tool Execution Aggressively
Tool calls are one of the biggest operational blind spots in agent systems.
Many implementations log only whether a tool succeeded or failed. That is rarely enough.
Useful traces should capture:
- tool input arguments
- execution duration
- returned payloads
- retry behavior
- validation results
- external API responses
- rate-limit events
- exceptions
One overlooked issue in production systems is silent retries.
An agent may appear slow because a downstream service retried multiple times before succeeding. Without trace-level visibility, latency spikes become difficult to explain.
Log Prompt and Model Metadata
Prompt changes alter behavior far more than many engineering pipelines account for.
That becomes dangerous when prompts evolve rapidly during experimentation. Otherwise, regression analysis turns into guesswork.
An engineering group I worked with discovered a prompt optimization had unintentionally increased token usage by nearly 40 percent because the agent began generating longer internal reasoning chains before tool selection. The output quality improved slightly, but infrastructure costs climbed sharply over several weeks before anyone noticed.
Observability data exposed the pattern almost immediately once token telemetry was added to traces.
What Engineers Usually Miss During Early Implementation
The first version of an observability pipeline is almost always too shallow.
Most systems begin by logging requests and responses while ignoring intermediate state changes. That approach fails once workflows become complex.
Intermediate events are often where the real operational signals appear. Another recurring problem is storing observability data without structure.
Massive volumes of unstructured logs quickly become unreadable. Structured telemetry using standards like OpenTelemetry semantic conventions creates far more usable debugging workflows because events remain searchable and correlated.
This becomes increasingly important as organizations adopt multi-agent systems.
Once agents begin delegating work to other agents, execution chains become significantly harder to follow without standardized traces.
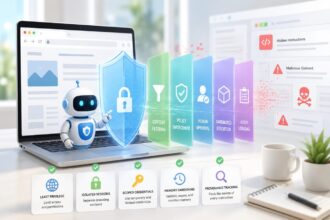
Security Problems Hidden Inside Observability Pipelines
Observability systems can quietly become data exposure risks if instrumentation is handled carelessly.
Many traces contain customer inputs, internal prompts, API credentials, retrieval payloads, financial records, or private business logic
Raw logging across every span may improve visibility while simultaneously creating compliance problems.
Some organizations only realize this after observability platforms begin indexing sensitive payloads automatically.
Effective implementations usually apply:
- field-level redaction
- payload filtering
- sampling policies
- retention limits
- encrypted storage
- role-based access controls
Visibility should not come at the expense of operational security.
AI Observability Is Becoming Operational Infrastructure
Observability in AI systems is moving beyond debugging.
Increasingly, traces are being used as operational datasets for evaluation, regression testing, safety analysis, and cost optimization.
Production traces reveal how agents behave under real-world conditions instead of controlled benchmarks.
That distinction is becoming increasingly valuable, especially as agents gain more autonomy.
OpenTelemetry’s work on generative AI semantic conventions is pushing the ecosystem toward more portable instrumentation standards across models, orchestration frameworks, and tooling layers. That consistency will likely shape how organizations monitor AI infrastructure over the next several years.
The organizations building reliable agent systems are not necessarily the ones with the largest models. Often, they are the ones that can actually see what their agents are doing.